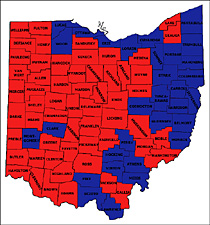
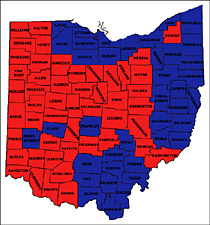
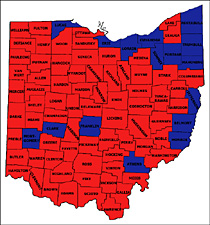
Votes for President By County
(Red - the Republican ticket; Blue - the Democratic ticket)
 1992 
1996 
2000 
Clinton-Gore (D)
1,984,945
(40.18)
Bush-Quayle (R)
1,894,310
(38.35)
Perot (I)
1,036,426
 (20.98)
Others (5+w/ins)
24,283
(0.49)
Total
4,939,964

Clinton-Gore Plurality: 90,635

Counties:
Clinton-Gore (D) - 31
Bush-Quayle (R) - 57
 

Clinton-Gore (D)
2,148,222
(47.38)
Dole-Kemp (R)
1,859,883
(41.02)
Perot-Choate (Ref)
483,207
 (10.66)
Others (4+w/ins)
43,122
(0.95)
Total
4,534,434

Clinton-Gore Plurality: 288,339

Counties:
Clinton-Gore (D) - 39
Dole-Kemp (R) - 49

Bush-Cheney (R)
2,350,363
(49.99)
Gore-Lieberman (D)
2,183,628
(46.44)
Nader-LaDuke (I)
117,799
 (2.51)
Others (4+w/ins)
50,208
(1.07)
Total
4,701,998

Bush-Cheney Plurality: 166,735

Counties:
Bush-Cheney (R) - 72
Gore-Lieberman (D) - 16

Historical Results for Ohio's Largest Counties

Cuyahoga County (Cleveland)
. 1992 . . . 1996 . . . 2000 .
Clinton/
Gore
337,548
(52.72%)
plurality
150,362
. Clinton/
Gore
341,357
(60.75%)
plurality
177,587
. Gore/
Lieberman
359,913
(62.62%)
plurality
167,814
Bush/
Quayle
187,186
(29.24%)
. Dole/
Kemp
163,770
(29.15%)
. Bush/
Cheney
192,099
(33.42%)
Perot/
Stockdale
112,352
(17.55%)
. Perot/
Choate
50,691
(9.02%)
. Nader/
LaDuke
16,956
(2.95%)
Others (5+w/ins)
3,155
(0.49%)
. Others (4+w/ins)
6,074
(1.08%)
. Others (4+w/ins)
5,814
(1.01%)
Total
640,241
. Total
561,892
. Total
574,782
12.96% of statewide total
12.39% of statewide total
12.22% of statewide total

Franklin County (Columbus)
. 1992 .. . . 1996 . . . 2000 .
Clinton/
Gore
176,656
(39.72%)
. Clinton/
Gore
192,795
(48.14%)
plurality
14,383
. Gore/
Lieberman
202,018
(48.79%)
plurality
4,156
Bush/
Quayle
186,324
(41.87%)
plurality
9,668
. Dole/
Kemp
178,412
(44.55%)
. Bush/
Cheney
197,862
(47.78%)
Perot/
Stockdale
79,049
(17.77%)
. Perot/
Choate
25,400
(6.34%)
. Nader/
LaDuke
10,702
(2.58%)
Others (5+w/ins)
2,772
(0.62%)
. Others (4+w/ins)
3,908
(0.98%)
. Others (4+w/ins)
3,492
(0.84%)
Total
444,801
. Total
400,515
. Total
414,074
9.00% of statewide total
8.83% of statewide total
8.81% of statewide total

Hamilton County (Cincinnati)
. 1992 . . . 1996 . . . 2000 .
Clinton/
Gore
148,409
(36.79%)
. Clinton/
Gore
160,458
(43.13%)
. Gore/
Lieberman
161,578
(42.76%)
Bush/
Quayle
192,447
(47.70%)
plurality
44,038
. Dole/
Kemp
186,493
(50.12%)
plurality
26,035
. Bush/
Cheney
204,175
(54.03%)
plurality
42,597
Perot/
Stockdale
60,145
(14.91%)
. Perot/
Choate
21,335
(5.73%)
. Nader/
LaDuke
9,222
(2.44%)
Others (5+w/ins)
2,419
(0.60%)
. Others (4+w/ins)
3,782
(1.02%)
. Others (4+w/ins)
2,924
(0.77%)
Total
 403,420
. Total  372,068 . Total
 377,899
8.17% of statewide total
8.21% of statewide total
8.04% of statewide total

Montgomery County (Dayton)
. 1992 . . . 1996 . . . 2000 .
Clinton/
Gore
108,017
(41.27%)
plurality
3,266
. Clinton/
Gore
115,469
(50.00%)
plurality
20,078
. Gore/
Lieberman
114,597
(49.61%)
plurality
4,805
Bush/
Quayle
104,751
(40.02%)

 
. Dole/
Kemp
95,391
(41.30%)

 
. Bush/
Cheney
109,792
(47.53%)

 
Perot/
Stockdale
47,854
(18.28%)
. Perot/
Choate
18,298
(7.92%)
. Nader/
LaDuke
4,690
(2.03%)
Others (5+w/ins)
1,098
(0.42%)
. Others (4+w/ins)
1,799
(0.78%)
. Others (4+w/ins)
1,908
(0.83%)
Total
261,720
. Total  230,957 . Total
 230,987
5.30% of statewide total
5.09% of statewide total
4.91% of statewide total

Copyright © 2004 Eric M. Appleman/Democracy in Action.